
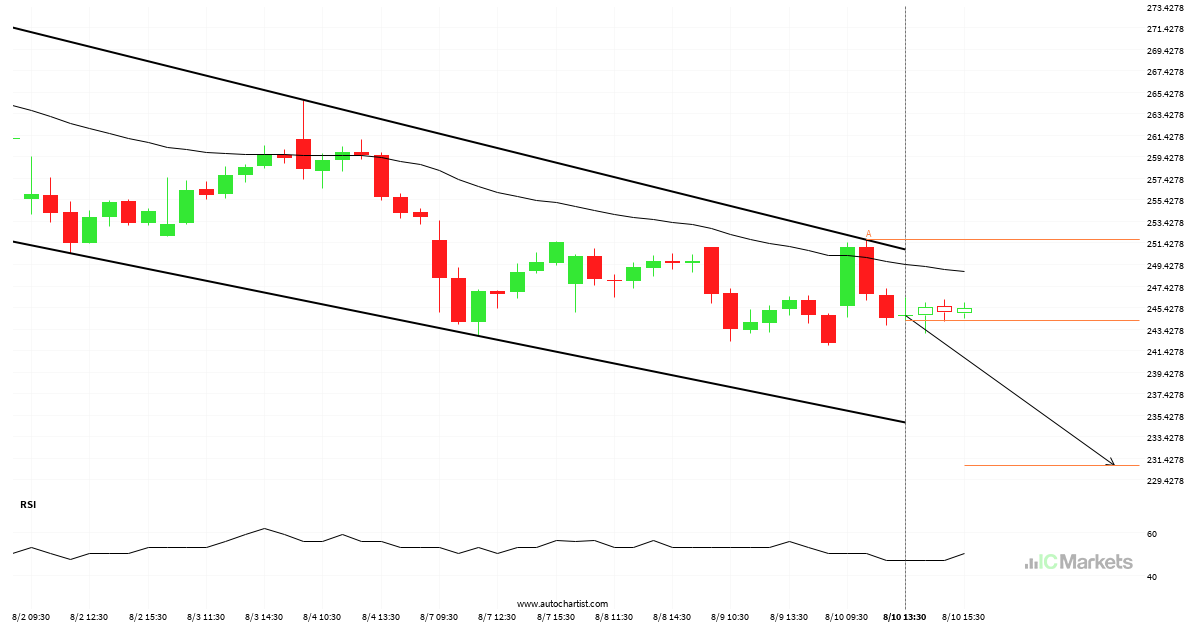
Tesla Inc. approaching support of a Canal descendente
Tesla Inc. is approaching the support line of a Canal descendente. It has touched this line numerous times in the last 11 days. If it tests this line again, it should do so in the next 11 hours.
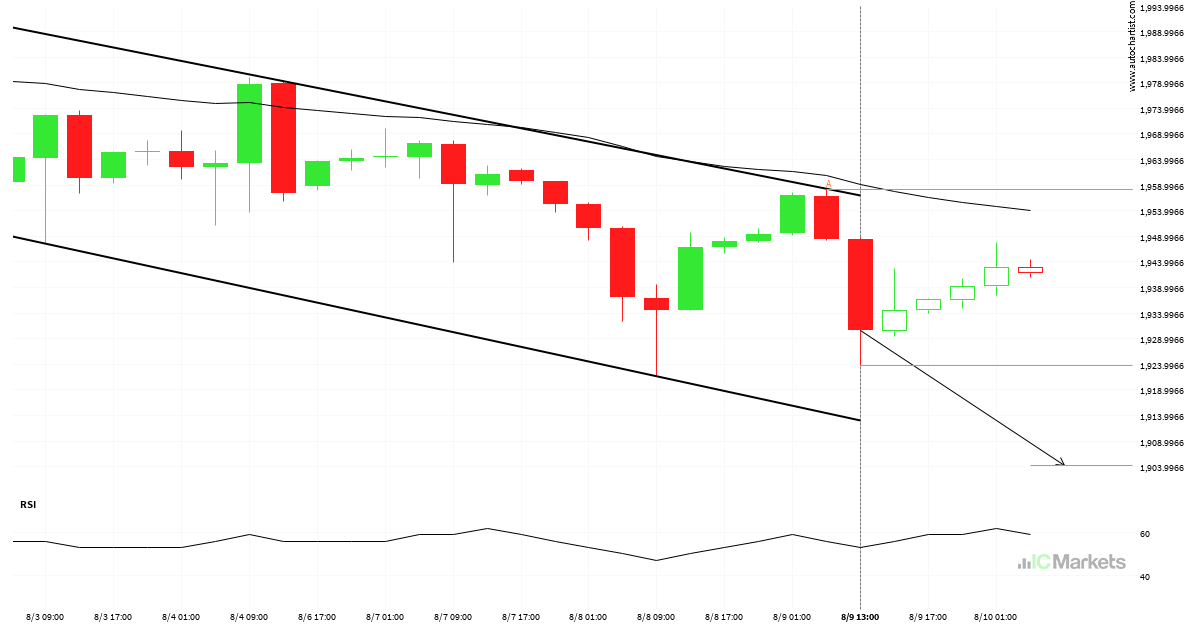
US Small Cap 2000 Index approaching support of a Canal descendente
US Small Cap 2000 Index is approaching the support line of a Canal descendente. It has touched this line numerous times in the last 9 days. If it tests this line again, it should do so in the next 10 hours.
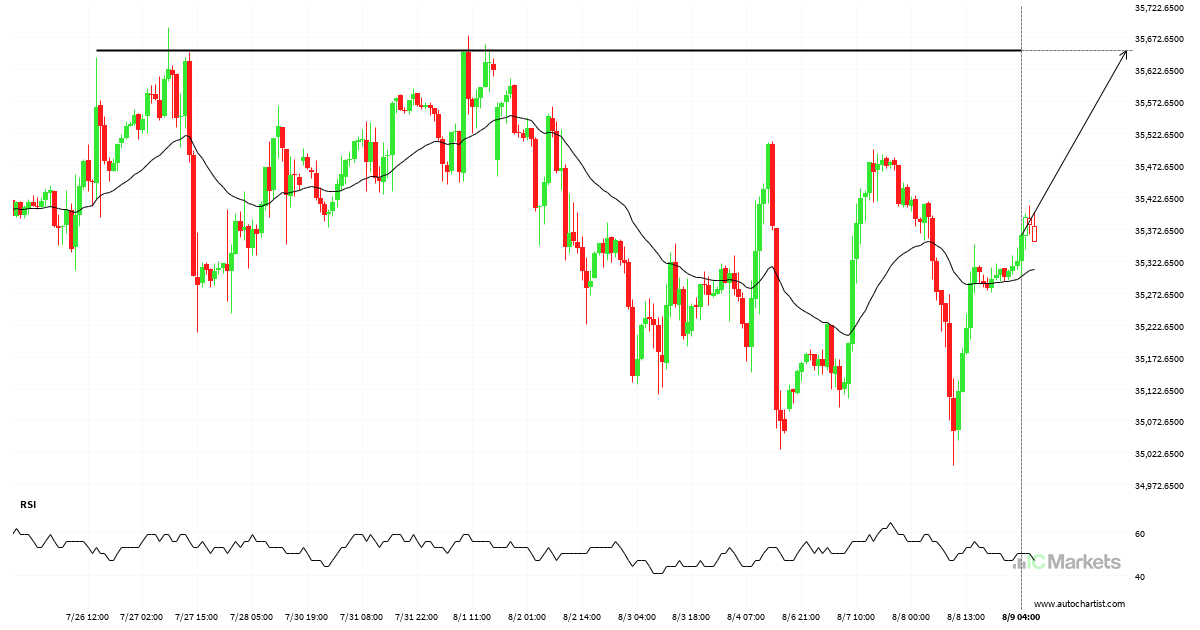
US Wall Street 30 Index approaching important 35653.1016 price line
US Wall Street 30 Index is approaching the resistance line of a Resistência. It has touched this line numerous times in the last 14 days. If it tests this line again, it could do so in the next 3 days.
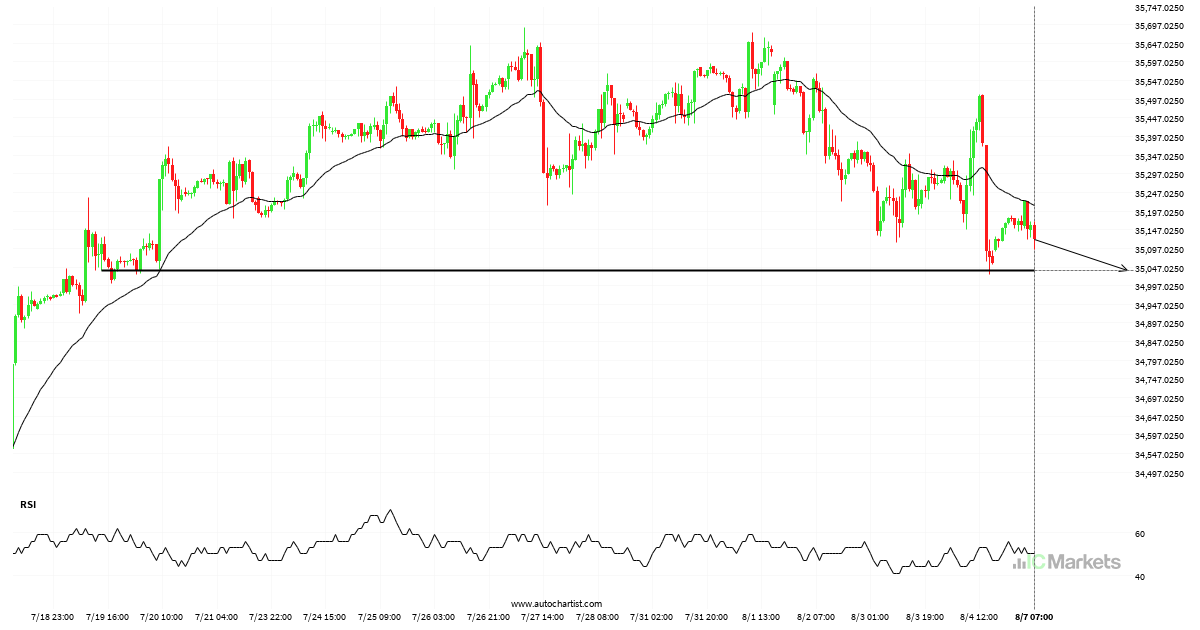
US Wall Street 30 Index approaching important 35037.6016 price line
US Wall Street 30 Index is approaching the support line of a Apoiar. It has touched this line numerous times in the last 19 days. If it tests this line again, it could do so in the next 4 days.
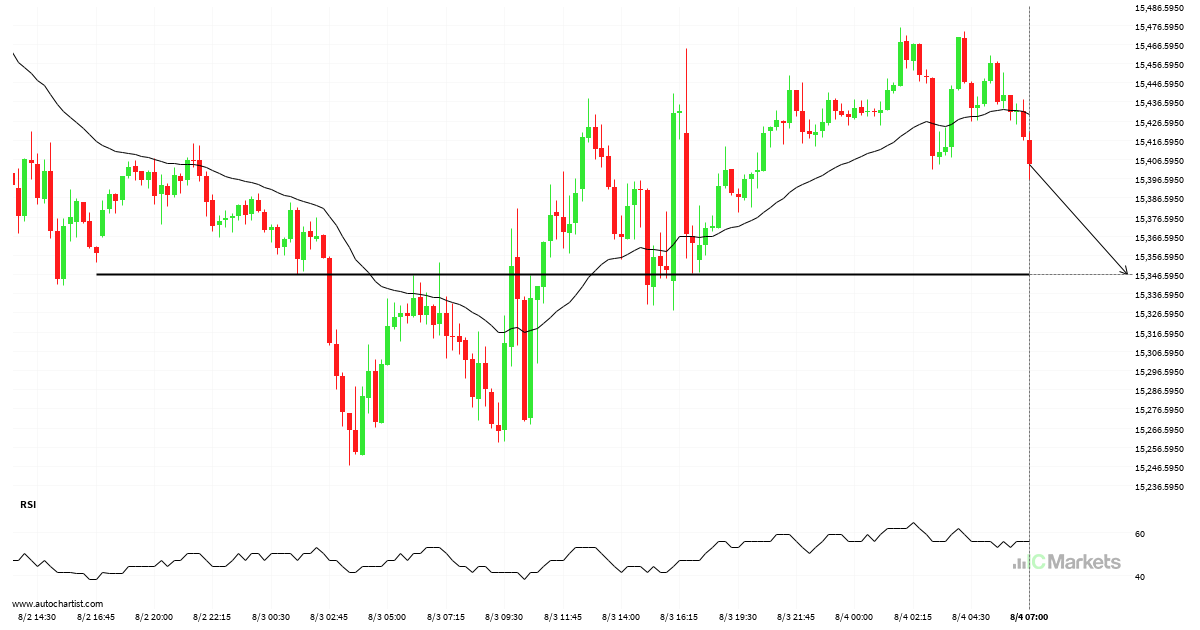
Either a rebound or a breakout imminent on US Tech 100 Index
US Tech 100 Index is heading towards a line of 15346.5996. If this movement continues, the price of US Tech 100 Index could test 15346.5996 within the next 9 hours. But don’t be so quick to trade, it has tested this line numerous times in the past, so this movement could be short-lived and end […]
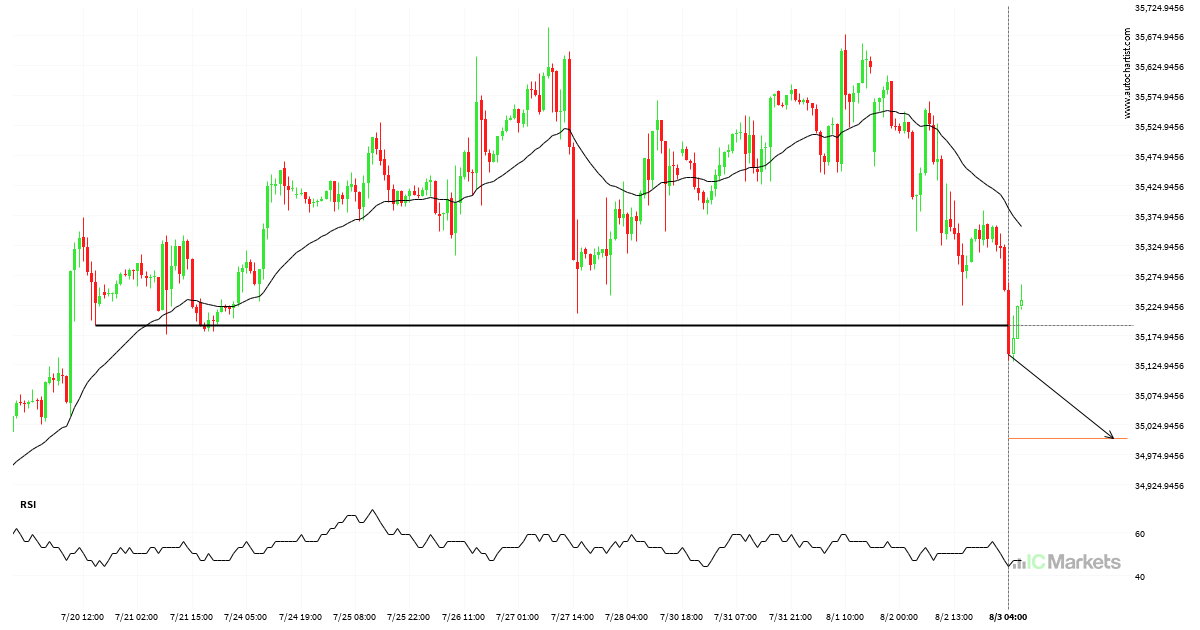
Important price line breached by US Wall Street 30 Index
US Wall Street 30 Index has broken through 35191.1992 which it has tested numerous times in the past. We have seen it retrace from this price in the past. If this new trend persists, US Wall Street 30 Index may be heading towards 35001.3086 within the next 3 days.
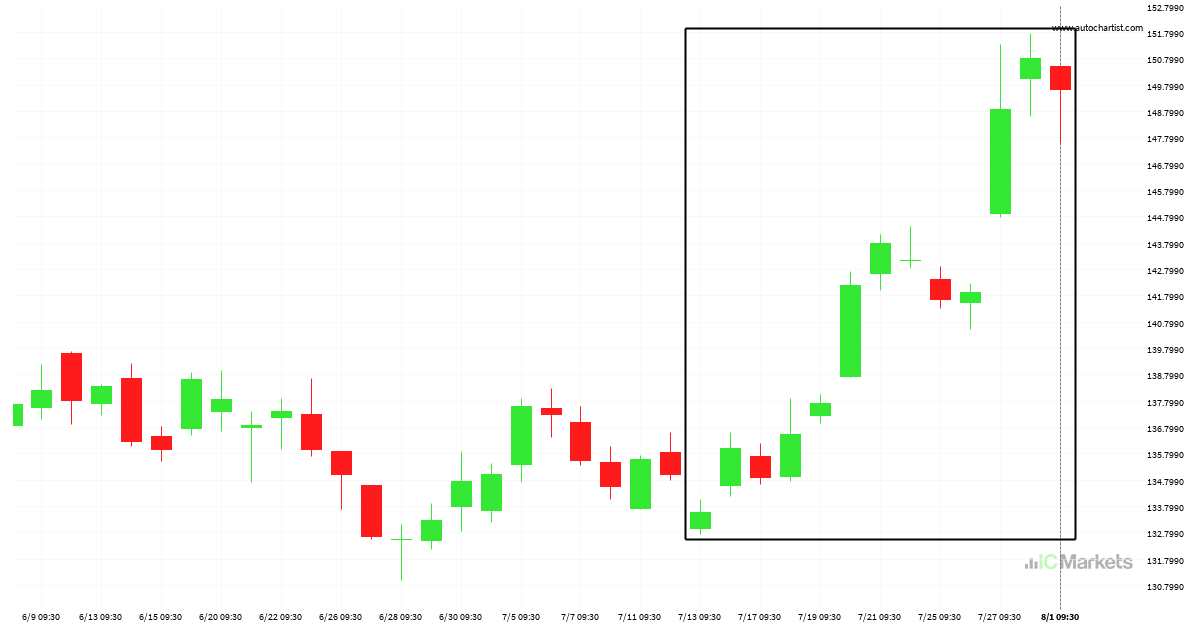
Huge bullish move on AbbVie
AbbVie has moved higher by 11,99% from 133,58 to 149,6 in the last 20 days.
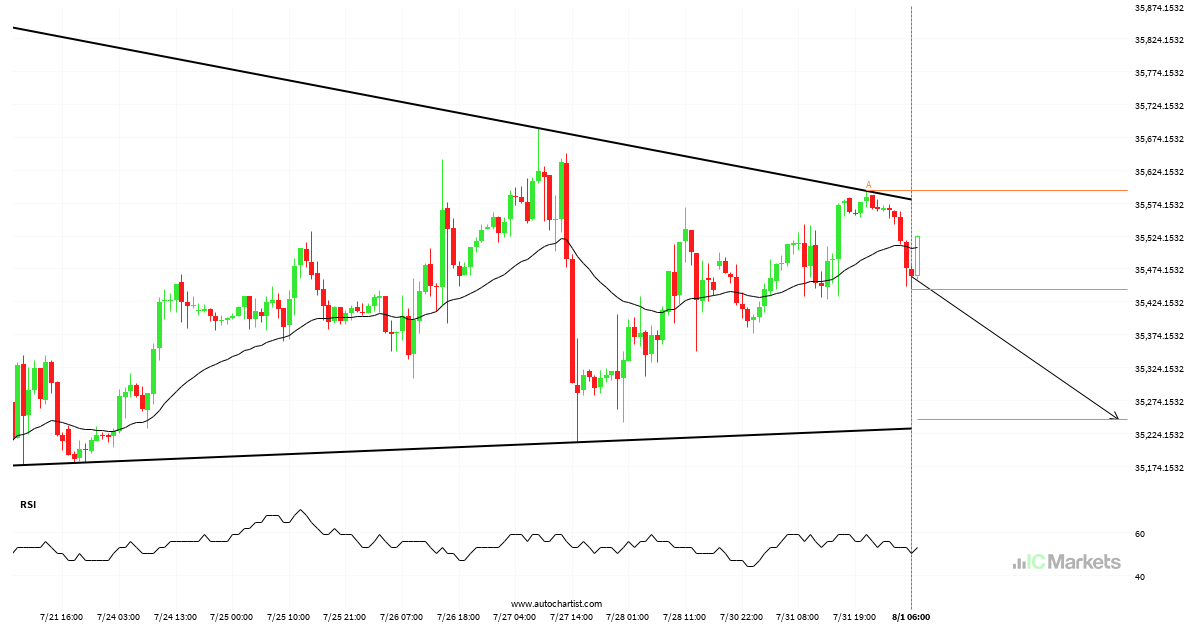
US Wall Street 30 Index approaching support of a Triângulo
US Wall Street 30 Index is approaching the support line of a Triângulo. It has touched this line numerous times in the last 12 days. If it tests this line again, it should do so in the next 2 days.
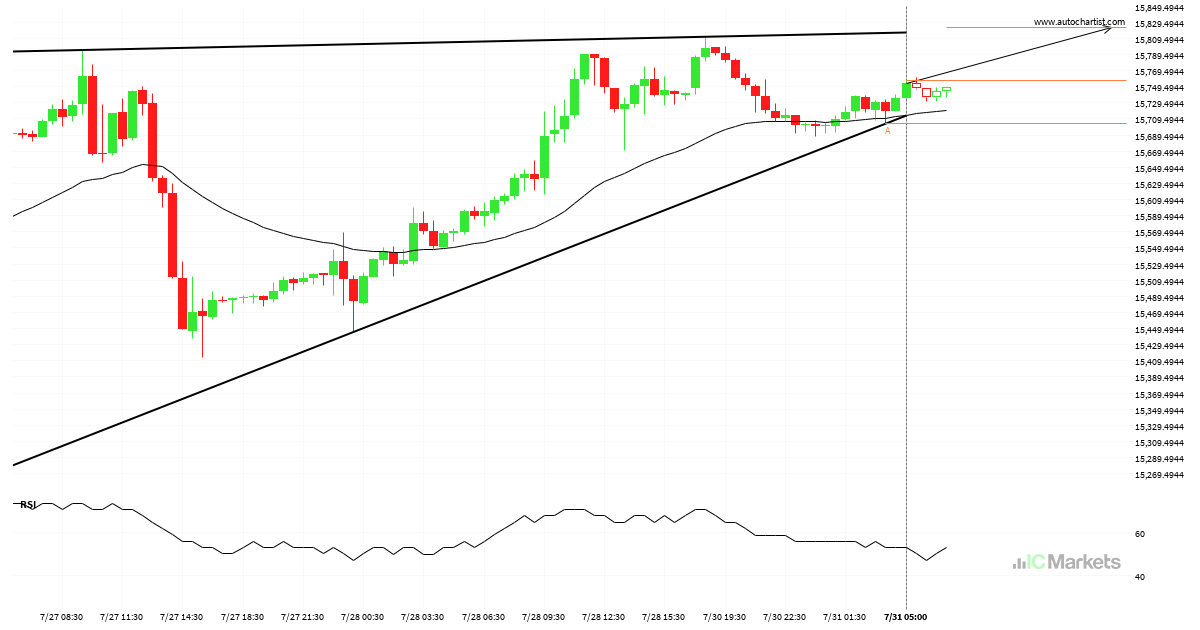
US Tech 100 Index approaching resistance of a Triângulo Ascendente
US Tech 100 Index is approaching the resistance line of a Triângulo Ascendente. It has touched this line numerous times in the last 5 days. If it tests this line again, it should do so in the next 11 hours.
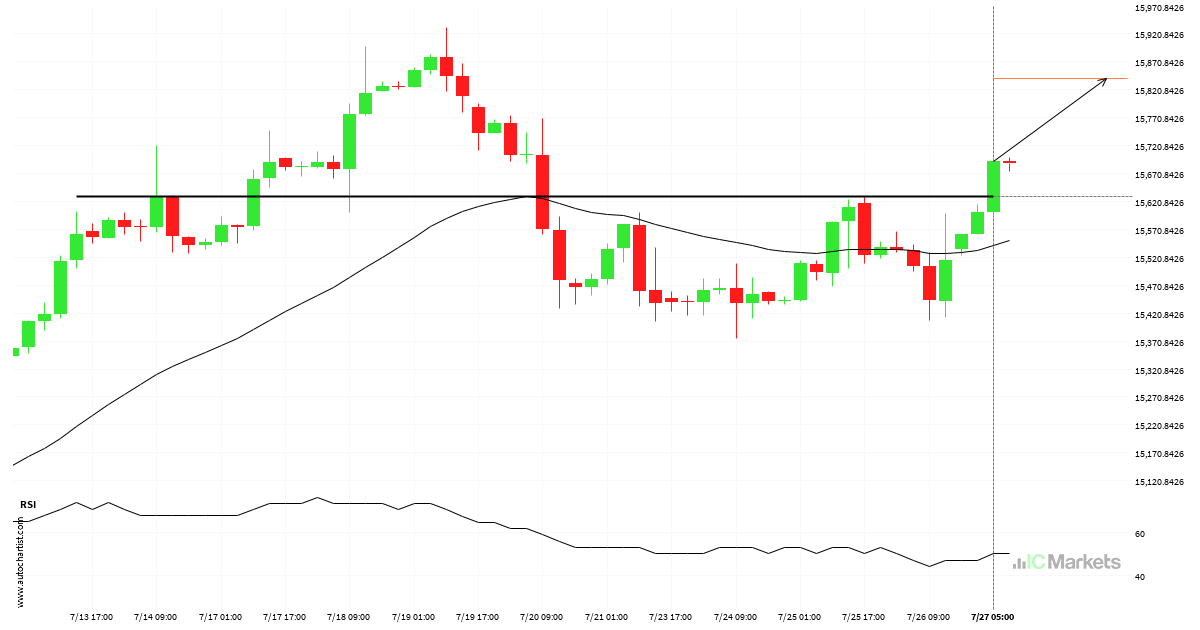
US Tech 100 Index broke through important 15629.2998 price line
US Tech 100 Index has broken through a resistance line. It has touched this line numerous times in the last 14 days. This breakout shows a potential move to 15840.3896 within the next 3 days. Because we have seen it retrace from this level in the past, one should wait for confirmation of the breakout.